Sensitometry
Description
This section is from the book "Airplane Photography", by Herbert E. Ives. Also available from Amazon: Airplane photography.
Sensitometry
The most generally used system of sensitometry is that of Hurter and Driffield, commonly referred to as the "H & D." By this system, in order to determine the characteristics of a given photographic plate, it is necessary to take a series of graduated exposures, a standard illumination of the plate being varied in known amount by a rapidly rotating disc cut to a series of different openings, or by some other suitable means. The negative thus obtained is developed in a standard developer for a definite time, at a fixed temperature, and is then measured for transmission on a photometer. The following terms are defined and used in plotting the results:
Hurter and Driffield pointed out that a negative would give a true representation of the differences in the light and shade of the object if it reproduced these differences by equivalent differences in opacity. This is equivalent to stating that if the densities are plotted against the logarithms of the corresponding exposures, a straight line should be obtained at 45 degrees to the axis of exposure times. If the line is at another angle the opacities of the negative will be proportional to the brightness of the object photographed, but the contrast will be different.
A typical H & D plot is shown in Fig. 103. It will be noted that two curves are shown. These are obtained with different developments, and illustrate the fact that the contrast or proportionality between exposure differences and opacity differences is a matter of time of development. Each of these curves exhibits certain characteristics which are common to all made in this way. There is primarily a straight line portion, where opacities are proportional to illumination. This is commonly called the region of correct exposure. The slope of this straight line portionthe ratio of log^xp^ure k tne development factor, commonly denoted by "r," a gamma of unity denoting exact tone rendering. Below the region of correct exposure is a "toe," or region of smaller contrast, called the region of under exposure. Above the correct exposure region is another where the opacity approaches constancy (afterwards decreasing or "reversing"), called the region of over exposure.
The speed of a plate on the H & D scale is given by the intersection of the straight line portion of the characteristic curve when produced, with the exposure axis. This interinfinity), and the larger this is the more a plate can be forced in development. If the plate fogs in its unexposed portions this fog is measured and recorded in density units along with the other constants. The speed of development is represented by the velocity constant, commonly symbolized by k.
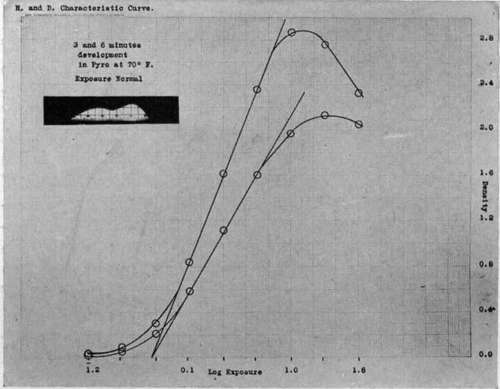
Fig. 103. - Typical characteristic curves of photographic plate.
The length of the straight line portion determines the latitude of the plate, or the range of permissible exposures to secure a "perfect negative." Thus if we assume that an section point, called the inertia, is the same irrespective of the time of development, as is shown in Fig. 103. The numerical value of the speed is obtained by dividing 34 by the inertia, when the exposure is plotted in candle-meter-seconds.
If a plate is developed until no more density and contrast can be obtained, its development factor is then y^, (gamma object has a range of brightness of 1 to 30, then a plate with a straight line characteristic extending over a range of 1 to 120 would have a latitude of or 4. That is, the exposure could be as much as four times the necessary one, and still give the sameresultonasufficientlyexposedprint. Ifthelatitudeofthe plate is too small, the shadows will fall in the under exposure region, the high-lights in the over exposure portion of the characteristic curve, with consequent poor rendering of contrasts.
Continue to:
- prev: Chapter XVIII. Characteristics Of Photographic Emulsions
- Table of Contents
- next: Criteria Of Speed
Tags
camera, lens, airplane, aerial, film, exposure, photography, maps, birdseye